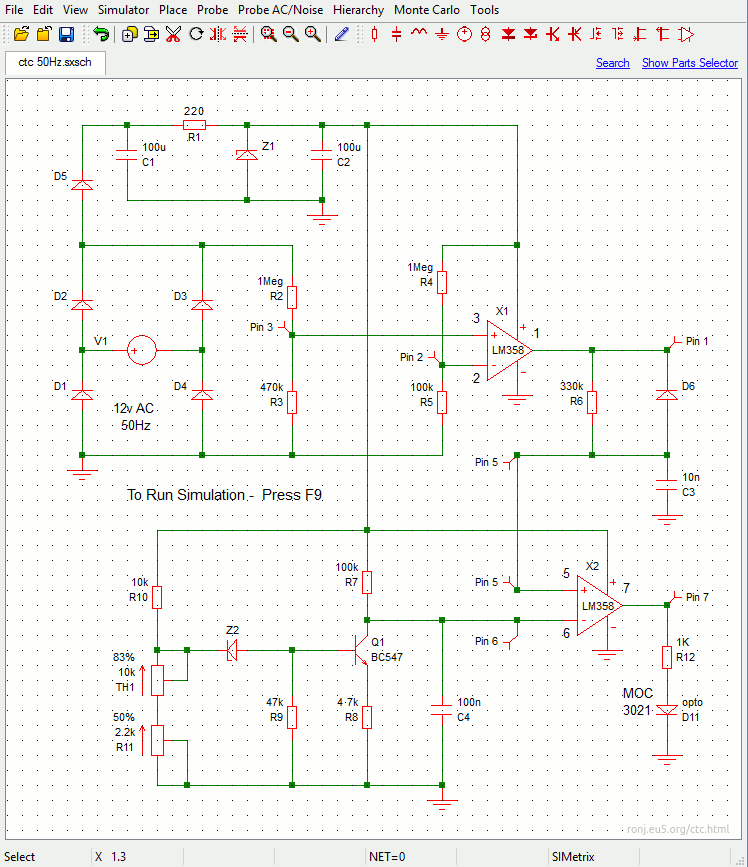
You can use the free SiMetrix Circuit Simulator to run My Simulation. Or you can use my observations, tips and techniques - to help you create a suitable file for a different simulator programme. If you do decide to create your own simulation - it's still worthwhile downloading SiMetrix - just to compare my results.
I've included both a 50Hz and a 60Hz version of this simulation in the Download Material. Below is the 50Hz version. However, (except for V1 & R6) the 60Hz version is virtually identical.
SiMetrix Screenshot

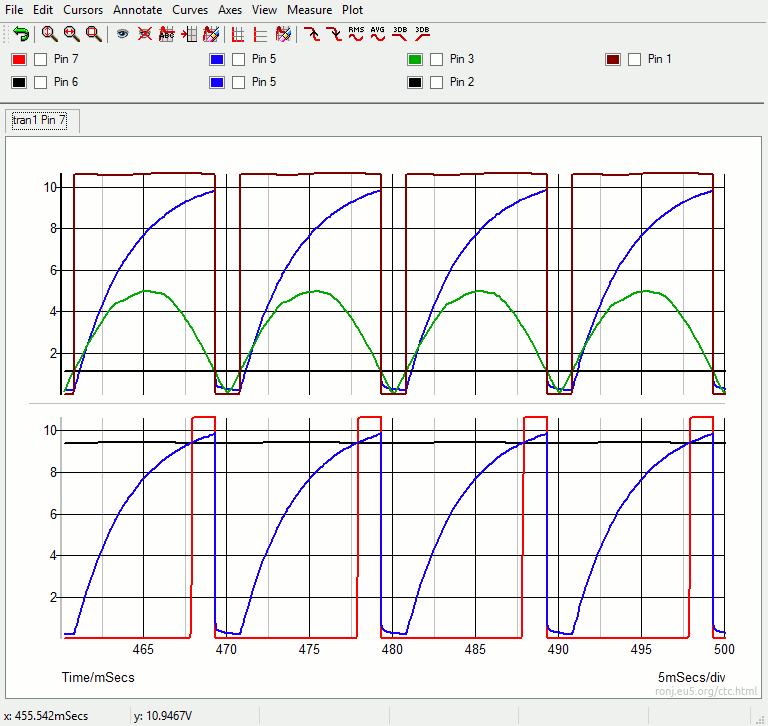
To make the graph clear - I've split it in two. The top half concerns Op-Amp No.1. The horizontal black line is the threshold voltage - on pin 2. The green line represents the half-wave clocking pulses at pin 3. The brown line represents the state of the output (pin 1). And the blue line represents the charge on C3.
When a rising (green) clock pulse crosses the (black) threshold - pin 1 goes high - and C3 begins to charge. When the clock pulse subsequently falls below the threshold - pin 1 goes low - and C3 discharges rapidly.
Graphs

The bottom graph concerns Op-Amp No.2. As before - the blue line represents the C3 charge curve. The black line represents the (pin 6) threshold voltage. And the red line represents the (pin 7) output pulse. When C3 takes pin 5 above the pin 6 threshold - pin 7 delivers the (red) output pulse to the MOC 3021.
The threshold voltage depends on the temperature. When it's low - the black line will be low on the graph. The blue line will cross it early. And the red output pulse will be wide. As the temperature rises - the black line floats upwards. The blue line crosses it later and later. And the red output pulse gets narrower and narrower.
This process continues until the amount of heat being produced - exactly matches the amount of heat being lost. Then the temperature stabilizes. And the circuit maintains this stability - by making one-hundred (120) fine adjustments to the heater's output - every second.
Power Supply Setting
The power source must be AC. Select the "Sine" option - and enter the frequency and the voltage required. I entered 12v/50Hz. Note that "RMS" is selected. You may find - later - that your 12v RMS has somehow magically transformed itself into about 17v "peak". This doesn't matter. Just ignore it.

Analysis Settings
The analysis is straight forward. Choose the "transient" option - and pick a "Stop Time". I set my stop time at half-a-second. I could have made it much shorter. In 500ms there are twenty-five AC cycles - that's fifty half-cycles. This makes the graph a little crowded.

My solution was to display only the final four half-cycles. By starting the "Data Output" at 460ms - my graph covers only the last 40ms. That's long enough for two complete AC cycles - at 50Hz.
|